Showing posts with label Undertow. Show all posts

Sunday, September 9, 2007

CITGO VIDEO ANALYSIS

CITGO VIDEO ANALYSIS
(working version posted June 28 2007)
Adam Larson / Caustic Logic
The Frustrating Fraud
Last Updated September 9 late pm
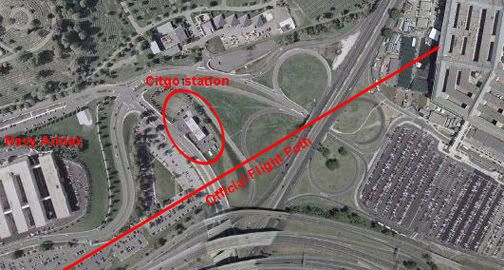


The Nexcom/Citgo gas station was the last real building near 77's flightpath before the Pentagon. Its security video was confiscated by the FBI on September 11 2001 (apparently NOT within minutes of the attack but rather a few hours later). It was held for five years and then released pursuant to FOIA requests on September 15 2006 to Judicial Watch.

The station had multiple cameras multiplexed together onto one screen. Some of the best views were NOT included in this compressed multi-camera screen. Whether this constitutes manipulation/forgery or some more inoccuous explanation I can't say for sure. But it is suspicious, and some of the cameras themselves seem to have been removed since then.


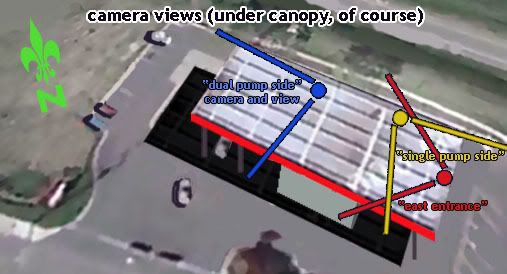
Youtube link: http://www.youtube.com/watch?v=2LJvFjsl6zk&mode=related&search= An analysis of what the remaining low-resolution screens show is in the works. Previously I'd said it showed "more nothing than anything yet," but in fact there are good clues in there. Of special interest are three camera views, mapped out on the model below.
Dual-Pump Camera and the Canopy Flash
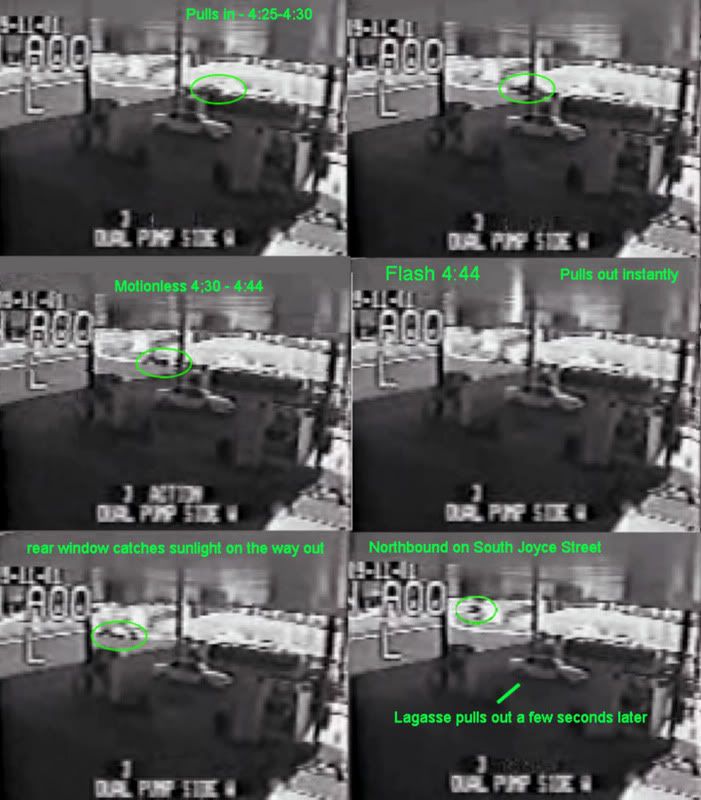
Just looking at the view from the "dual pump side" camera (the north end of the station) we see a flash at 4:44 in the video, or 9:40:38 by the video's internal clock (app. set about 3 minutes ahead). The white car there most of the time at the pump is Sgt. Lagasse's. The sequence here: a black and white patrol car pulls in and sends the flash of light, reflected from somewhere else apparently to the south, onto the underside of the canopy, at which point the patrol car speeds away, possibly towards the Pentagon
My video - part 1 of the Citgo analysis, just the canopy flash.

Youtube link: http://www.youtube.com/watch?v=3ChV5gxYfrc#GU5U2spHI_4

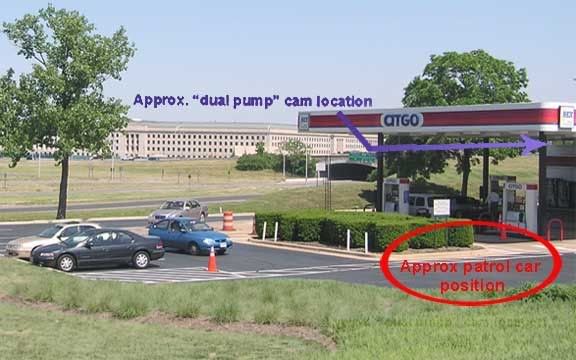
Here is a photo of the station's north end - parking, hedges, canopy and pumps - with the Pentagon visible in the background. Compare to the camera view above.
Before getting to angles, I must note that some north-path proponents contend this flash is either from the plane but glancing off the car's roof, or simple sunlight reflected in a flash as the patrol car started rolling (see comments at the Youtube link for my video). It does seem to start inching forward just just a hair early - too subtly it seems to account for a sudden flash, but enough to make this interpretation seem feasible. The angle the light is coming from seems about the same as the angle of natural sunlight at that time, but a different part of the car also catches sunlight a few frames later in a different position. (I intend a fuller anlysis on the timeline of all these events). John Farmer's rebuttal and my counter-rebuttal: link.

However, as I will expand on in this space and with further short videos, there was also a noticable flash of light on the south side of the station a split-second earlier, clearly not reflected from the south side of a car on the north side of the station. There's also employee/customer reactions indicating something happening to the south, and a large shadow also visible on a roadway south of the Pentagon. These will be explained and even if the canopy flash is just sunlight, it somehow seems to show the same thing the other clues do: something other than the sun was sending light to /blocking light from the Citgo, from the south and southeast just before people started gawking towards the Pentagon. A high-speed, low-flying silver AA 757 is one possible culprit for at least one of these clues...

East Entrance (south) View and the Double Flash
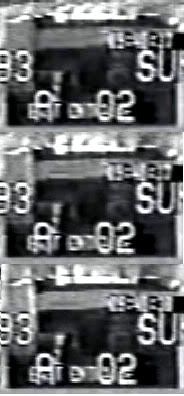
This "East Entrance" camera is at the southern edge of the southeast canopy looking back at the store to monitor customers coming and going. Note at left the lightening on the left-hand side, on the narrow east-facing edge of a wall there. This "flash" seen at 9:40:37 is longer in duration than the one off the patrol car half-a-second later, and perhaps better described as a "double-pulse." In slow-motion (video coming) there is an intial pulse just before the canopy flash, which washes in top-to-bottom and fades just as another pulse of light blankets the spot and then fades. Duration: unsure at the moment but seems to be about one second. The light source is roughlly to the east, and could be from either a plane heading from the north or the south.


Below is the video of this flash. Sorry for the glitch - it hangs up just before "slow-motion." Maybe I'll re-post it.


The Shadow
Thanks to John Farmer's interesting work, I can see the shadow now. It's visible in the south-side "Single Pump" camera, and cast on the roadway behind the station (South Joyce Street), divided in two by some invisible obstruction (possibly a median/divider). It appears at 9:40:35 (about 2 seconds before the flashes) by the video's clock and remains for about 8 frames, 1/4 of a second (though it appears stationary, apparently a still frame taken at 4 fps). All-in;all it's a large shadow. A 757 is one possibility.
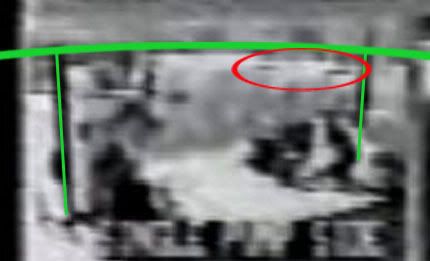
I know this is crap quality to be blowing it up so big, but hey,
it's there. It can be (roughly) measured.
Youtube link: http://www.youtube.com/watch?v=hF-GcL8hR68

General Thoughts
Quotes from north path/no plane supporters: would these researchers talk about this key evidence like this if they thought it supported their theory or was irrelevant? (most from the inital Loose Change thread spurred by Russell Pickering's analysis)
John Doe X: "Talk about chasing shadows...lol." link
Aldo Marquis/Merc: "I believe the Citgo video was released SPECIFICALLY because of the Citgo witness and his account. I no longer believe this as a possibility, but as an unforunate reality. A counter chess move if you will. [...] This is a clever trick in response to the Citgo employee's account. Simply more bad video with a few editing/graphic/lighting tricks, just like the others." link
Undertow: "You know, I started to analyze that flash 4:44 (mov time) but it's just worthless in all its pixelated compressed crappyness. I don't know what anyone can possible get out of this video besides a migrane." link
(John Farmer's quote removed - I'm not so sure now he belongs on this list)
Craig Ranke (Lyte Trip): "No serious 9/11 researcher would take this video at face value. It makes zero sense." link
Craig Ranke to me: "Evidence tampering is a Federal offense and if you insist on supporting this dubious data that is supplied from the very individuals that you accuse of this crime you are just as guilty as they are." link

So naysayers aside, and all concerns of legitimacy vs. fakery taken into account (the grain of salt one must take this with), the analysis continues.

Tuesday, August 21, 2007

NTSB ANIMATION INTERNAL GEOGRAPHY, PART 3: GRID CLUES: ORIENTATION AND PROPORTIONS

NTSB ANIMATION INTERNAL GEOGRAPHY, PART 3: GRID CLUES: ORIENTATION AND PROPORTIONS
Adam Larson / Caustic Logic
The Frustrating Fraud
August 21 2007
last updated 8/22, 1:00 pm


I had promised a piece on the grid's "latitudelines," but that one will take a little more work and could use some foreshadowing, and so here are four clues to what I'm starting to decide on...

Regarding the background grid of the NTSB's Flight 77 animation, the questions of rectangular parcel proportions and overall northern orientation are closely related. Wondering how it’s oriented may seem silly; one would presume the Safety Board’s experts, if not the FDR itself, would correct what the compass knows and show the plane on a true east-west north-south grid, with the magnetic headings showing up off from these (to almost exactly ten degrees) as they would have in real life. This does not seem to be the case.

Four clues:
1) Mini-master map:

the full flight path is reproduced in the small window at the lower left of the animation screen and offers clues to both proportions and slope. Here is a screen cap with enhanced lines vs. official flight and real lat-long lines crossed. The animation seems to stretch the flight path over almost three squares. Undertow pointed this out to me, though I’d noticed it before, and it’s definitely a possible clue. If these mark some amalgamation of the onscreen rectangles, they should have the same proportions as those smaller parcels. That is, if a block of say 60 minutes by 60 minutes is square, a one-by-one minute unit should also be square. There is also, obviously, an angular slope evident between the two; the lower portion, again, shows the true east-west orientation of the official path, while the grid lines around the animation’s mini-map are rotated about 8-9 degrees counter-clockwise, just about consistent with magnetic north (declination 10.08 degrees).

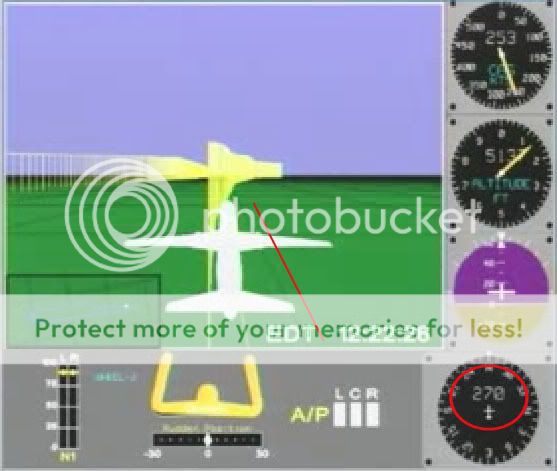
2) lines at 270°
At 8:22 am the plane has a heading (nosecone orientation) of 270 degrees - due west from magnetic north, just southwest of west in true terms. It's just about parallel with the nearest latitude-looking line, and perpedicular to the longitude lines ahead. As for parcel proportions, they look fairly square here. However, perspective at this fairly low altitude of 5137 feet is fierce and makes it unclear and inconclusive.

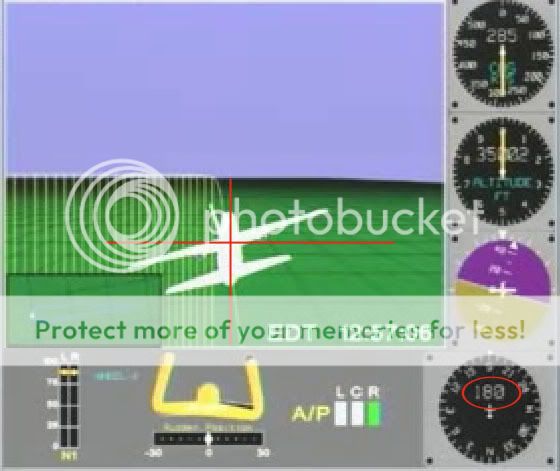
3) Lines at 180°
As the plane nears the mid-point of its southward turn, at 8:57, the longitude line under it shows exactly vertical, and latitudes ahead of it exactly horizontal. The heading dia shows 180, or due south. This would make perfect sense if the grid were oriented to magnetic north. These rectangles also look remarkably square seen from an elevation of over 35,000 feet, as opposed to the roughly 5:7 proportions of latitude/longitude intersections there in the real world.

4) Lines at 70°
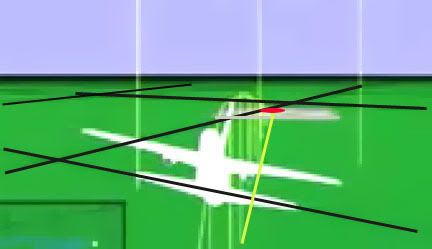
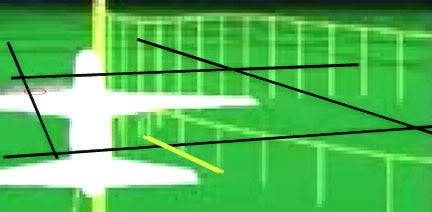
I wanted to analyze the final trajectory shown in the animation in relation to the global map, but found that harder than due west and south. To start with, here is a frame with grid lines, Pentagon location, and track (flight path along the ground) highlighted. The magnetic dial hovers right around 70° from north on this final track.

At right is another view from just before the grand loop show just where on that parcel’s west edge the ground track crosses. I figured If I marked this and de-skewed the parcel I could masure its angle of incidence.


To measure this angle for sure, I’d need to know the proportions of the rectangles, something made difficult by the foreshortened perspective. Again this looks fairly square to me, so just on a hunch I ignored real-world lines and tried de-skewing the grid there into a square. This is all a bit approximate, so don’t expect precision to more than a degree or two.

Interestingly enough, we get almost exactly 70 degrees, which is what the FDR says on that path (both in the CSV file and the animation’s heading dial). Subtracting 10 degrees for magnetic declination, we have the official trajectory of 60 that matches the physical damage.

On all four points above, the flight path reads correct in angles relative to its own internal geography, but not to real-world lines, in either placement or slope. From this, my best guess at the moment is that the animation program is pointing its longitude lines to magnetic north, and its latitudes perpendicular to that, throwing the whole grid off by a rotation of approximately ten degrees. And on top of that, it's generating a square grid map, unlike real-world lines, in which latitude lines are further apart than longitudes. This equilateral proportion indicates the flight path may've been rendered at some default equator on this globe rather than at the proper latitude. If the lines even represent latitudes and longitudes at all and not some other type of grid.

To see whether this is confirmed or denied by the latitude lines involved, I will be posting a detailed piece soon and even a short "video." In fact this is already up on Youtube and viewable at this link. Sorry for the low resolution and the choppiness of my frames. I hope it works - compare to the original animation if that helps.

Thursday, August 16, 2007

CSV/ANIMATION ALTITUDE DISCREPANCY

CSV/ANIMATION INITIAL ALTITUDE DISCREPANCY
Adam Larson / Caustic Logic
The Frustrating Fraud
August 16 2007
last updated 8/21


Note: Pilots for Truth senior member “Undertow,” who I admit has far more knowledge in this area than I, commented on the following piece “You can not possibly be this moronic about this. Please for the love of god stop confusing everyone.” (see comments below)

I read this as his seeing too many mistakes to be accidental, and so it’s probably an attempt to confuse, a feeling I'm familiar enough with. No, in fact, I can be, and was, this moronic. I am off on a lotta spots here, numbers and otherwise. Sorry, I was tired and inspired at the same time. The general gist is still right, but numerous minor alterations and further notes are to come… (in red) Apologies for any remaining confusion and please don’t take this as a final word on anything without consulting a non-obfuscationist expert first. In fact I'm not even saying much at all here.

But as “mod” says below “CL is going in the right direction IMHO. What does the Video say vs. the CSV file, in terms of pure numbers? 99% should match.” I also feel I’m onto something here or I wouldn’t’ve posted it… I just don’t know what yet. Maybe it’s nothing. But UT’s vehemence has inspired me: “Jesus, please stop and really think about this before posting anymore absolute nonsense.” Have done, and I got lots of red here now. Jesus. I'm done.

For more in-depth, piloty, and udeful analysis of pressure altitude readings, please see the lively and enlightened Pilots for Truth discussion thread at this link. Hopefully you're a member, or perhaps they'll provide me with a better link to help explain what I'm missing here. Otherwise do your own research or just hang tight to see what I come up with.
---
Where I was Wrong
Aha! I feel stupid but not really. I had previously concluded that the original, takeoff altitude for Flight 77 in the csv fille matched the same in the NTSB animation. It turns out I was incorrect. It was a mistake on my part but kind of odd how easily it lent itself to misreading.

1) The actual altitude at Dulles is about 300 ft msl as I’d heard. I verified this with Earthtools; runway 30 is on an slight uphill slope from about 285-295 feet MSL. I’ll call it 290.

2) The NTSB animation shows precisely 300 feet in the altitude dial on the ground. It’s not quite right, but close enough to be accurate. It also happens to match almost exactly the magnetic heading on that runway of 300 degrees from magnetic north, also displayed as 302 with the plane at rest.

The csv agrees on mag heading and lists it as 302 for the long runway pause, which is where I got mixed up. When I first dug in for altitudes, I saw it was luckily only the fifth of several hundred settings so would be easy enough to find. I had heard takeoff altitudes matched, so looked first for an altitude of about 300, I counted over five, six, whatever values and saw 302. Not realizing it was actually the mag heading, I took it as a verification of the animation’s rough accuracy. The reason I missed the actual pressure altitude is that it’s unusually different from the display alt at that point, while the mag heading is still much closer, if it were altitude in feet. And they’re listed right next to each other so I got mixed up.

In fact the beginning altitude listed in the csv is 40 feet, 250 feet too low to be accurate. This is a point of disagreement I haven’t heard anyone mention yet, though Undertow tells me I’m “covering ground which we plowed last summer.”

Tho it didn't come across as I noted a discrepancy, I do also understand the csv and animation attitudes should not exactly match – as UT usefully points out “The FDR produces a Pressure Alt and Baro column in the CSV. Together they create what the pilot would see on the Actual Alitmeter. Which is what is supposed to be shown in the Animation.” That is, the pressure alt reading “+” barometer correction = real altitude. The exact relation and expected differences I’m not totally clear on but getting there [another post]. What I'm really noting here is a massive difference I hadn't noticed before, apparently the mirror image of the 300-foot part of John Doe X's correction.

Tracking Back
I stumbled on this error while looking into another, related anomaly, a search that involved lots of backtracking. I saw that the final altitudes at 9:37:44 are near identical – 180 for the animation’s dial and 173 for the csv (of course they aren’t supposed to be, because of the omitted barometer reset). This final altitude is however misleading, and seems to be from a frame of data that didn’t play out and would have left the animation considerably lower. In the four seconds before that, the two reading carried a rapidly decreasing difference of 50 feet to 28 feet, with the animation lower. I didn’t bother tracking this discrepancy, but noted that they match up closer back around 9:24 (animation about 15-20 feet lower than the csv), both before and after the mysterious FL180 reset recorded in the csv that had no effect on the animation readout.

So clearly the altitude difference between the two is all across the board, but nothing in the difference range of hundreds of feet. Tracing back further, they also match roughly after the initial FL180 reset on ascent (at 8:28) with difference of 20-30 feet but with the animation higher this time. Since it reads lower near the end, there is a roughly 75-foot fudge room, at least, between the two, that comes in somewhere between 8:28 and 9:24. I don’t feel like tracking this down, especially since I had been looking for something else.

An Inexplicable 240-foot Gap
At the initial FL180 reset, on ascent, at 8:28, Pandora’s Black Box shows an altitude drop from 18273 to 18058, a difference of 215 feet. Despite having matched the csv before that (I thought) and after being only about 27 feet off. There is 242 feet of total discrepancy here, most of which is lost at 8:28 leaving a near-match after, which means the animation must’ve been set much higher than the csv before the change. Another error of the cartoon, no doubt.

I’d never noted it before, but lo and behold, the altitudes do not match before that onscreen drop. The difference is in fact about 280 feet, animation high. Since I “knew” they matched on the runway at 8:20, I traced it back over the intervening eight minutes to see where the discrepancy crept in. Actually I started at the beginning and made the same mistake of identifying 300 and then watched for the up-tick to match the animation after it started rising at 8:20:16. I suspected the csv would be slower, but it remained at about 300 all-down the 300-oriented runway second after second as the animated plane rose. Then I realized I was looking at the wrong column, that the discrepancy runs back to the first frames and the csv file’s original altitude is wrong – to the tune of 250 feet underground, the same discrepancy nearly erased with the onscreen altitude change (leaving as the remainder the smaller discrepancy).

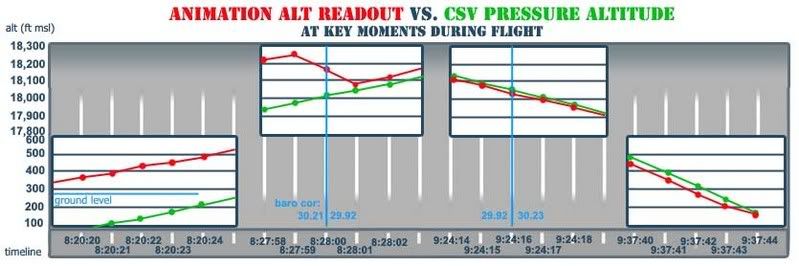
Here is a table of data at the relevant points: "baro cor" is the setting re-set at 18,000 feet both ways, once apparently by Capt. Burlingame, once by capt. Hanjour. + differences mean animation high, - means csv higher than animation.
time |baro cor | anim alt | csv alt | diff.
8:20:15 | -- | 300 | 59 |+241
8:20:16 | 30.20 | 304 | 52 |+252
8:20:17 | -- | 311 | 49 | +262
8:20:18 | 30.21 | 323 | 53 | +270
8:20:19 | -- | 339 | 61 | +278
8:20:20 | 30.20 | 363 | 83 | +280
8:20:21 | -- | 392 | 111 | +281
8:20:22 | 30.21 | 420 | 144 | +276
8:20:23 | -- | 456 180 +276
8:20:24 30.20 494 210 +284
8:20:25 -- 530 248 +231
8:20:26 30.21 568 290 +278
8:20:27 -- 614 330 +284
8:20:28 30.20 662 372 +290
8:20:29 -- 704 417 +287
8:20:30 | 30.21 | 755 | 469 |+ 286

8:27:54 | 30.21 | 18081 | 17785 |+296
8:27:55 | -- | 18129 | 17823 |+306
8:27:56 29.91 18140 17861 +279
8:27:57 -- 18179 17899 +280
8:27:58 30.21 18219 17938 +280
8:27:59 -- 18252 17976 +276
8:28:00 29.91 18166 18015 +151
2:28:01 -- 18083 18056 +27
8:28:02 30.21 18118 18093 +25
8:28:04 29.91 18198 18170 +29
8:28:06 | 29.94 | 18278 | 18247 | +30
… …
9:24:10 | 29.92 | 18264 | 18285 | -21
9:24:11 --- 18222 18245 -23
9:24:12 29.91 18185 18205 -20
9:24:13 -- 18151 18168 -17
9:24:14 29.92 18106 18126 -20
9:24:15 -- 18071 18088 -17
9:24:16 30.23 18030 18049 -19
9:24:17 -- 17993 18011 -18
9:24:18 | 30.01 | 17956 | 17972 | -16
… ... ...
9:37:40 | 30.23 | 445 | 496 | -51
9:37:41 --- 351 399 -48
9:37:42 30.24 279 307 -28
9:37:43 --- 211 239 -28
9:37:44 | 30.23 | 180 | 173 | +7
---
Here is the graph of five seconds at each of the four key spots. One can see how a roughly 300-foot jump in the animation altitude (red) would be expected at the second re-set. I'm not sure what exactly to make of this, this is just to illustrate. (view in new window to see it full-size)

Clearly, there is a massive discrepancy only for the first eight minutes of flight and back on the runway. So this piece stands as two points:

1) I correct myself on a silly mistake – the initial csv altitude I had previously worked with was grossly wrong
2) Whether or not they should, the animation dispaly and csv pressure altitudes roughly match all through the flight, as I have previously noted, except for these first eight minutes.

And since I just now figured this out I don’t want to say what it means – if the JDX correction is boosted by this or if this reveals something else. That's in the math I'll do a bit later. But it cleary raises questions about the data itself, if not about what physically happened.

Saturday, August 4, 2007

20 MINUTES AND 20 MILES FROM TRUE

20 MINUTES AND 20 MILES FROM TRUE
CSV LONGITUDE READINGS
Adam Larson / Caustic Logic
The Frustrating Fraud
August 4 2007


A recent anonymous comment left under my post Pentagon NTSB Animation is Wrong! said:

“Funny stuff watching a bunch of half witted pilots and so called experts run around making up ideas on something they do not understand but have been told about. Take a look at the FDR data please. Now tell me where is Flight 77 at takeoff, and at the last data point. Come on experts like Snowy, tell me where Flight 77 is. Any point in time will do. Bet you can not place it better than 1000 to 3000 feet. Too bad we did not have GPS to knock that down to 100 to 300 feet. Sad thing is, after reading the posts around the internet, the FDR was found in the Pentagon as were all the bodies from77. The people who make up stuff about Flight 77 are sick people.” [1]

I remembered some comments from the “experts” at Pilots for 9/11 Truth about positional problems in this data, so I took the challenge and found – ironically enough – the debunker had pointed to an interesting anomaly that it seems places the plane’s final resting place twenty miles west of the Pentagon. I duly note the irony that this gives me something to agree with the Pilots over, as core member Undertow had just alerted me of “the CSV Lat/Lon data screw up,” wherein “it is off by 20 Minutes.” [2]

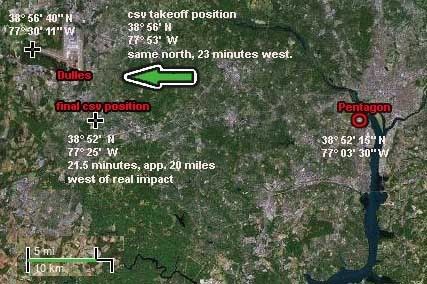
It’s somewhat daunting to look into the CSV file, but this time it only took a few minutes to ascertain the final recorded position: N38°52',W077°25'. There are no seconds reading to pinpoint (60 seconds make a minute, 60 minutes a degree), but it appears about right for north placement, but far off for the longitudinal (east-west) placement. It should read 77°3’30” Indeed, it’s off by 21.5 minutes, in this case a discrepancy of roughly 20 miles, or directly over Chantilly.

Where does this discrepancy enter the picture? I feared it would take a while to track it back, but again, no problem. Location at takeoff (from frame 08:21:27: N38°56',W077°53' The map I looked at places the end of the runway at 38° 56' 40" N, 77° 30' 11" W. Again the same northern position, but 23 minutes to the west. The discrepancy is there the whole time. The slight difference is probably due to the lack of seconds data that would tell just where in each zone it was for sure, introducing a small fudge factor of inevitable imprecision.
Pilots ally John Farmer has analyzed the data closely and found it "unreliable," and now I see clearly what means when he says the csv file "has the plane taking off from a field west of Dulles and crashing somewhere well west of the Pentagon (look at the coordinates stupid).” [3] In fact, as seen in the map above, its data ended just south of Dulles where it was supposed to have begun. The data set gets curiouser and curiouser. But why? And to what net effect?

The difference runs across the board and so is almost as easy to correct as the animation's four-hour-ahead time stamp. Simply add about 21-23 minutes to the west readings. That and realize there’s no real precision possible with the csv’s numbers other than that it took off just as Flight 77 departed Dulles, and ended just about 20 miles east of this origin just at nearly the second that Flight 77 is said to have hit the Pentagon 20 miles east of it's origin. I can’t say for sure but this FDR anomaly seems massive, inexplicable, and totally irrelevant.

Sources:
[1] http://frustratingfraud.blogspot.com/2007/05/ntsb-animation-is-flat-wrong.html - comment left 7/27/07, 7:56 pm
[2] Undertow. Posted July 26 2007, 9:36 am. Above Top Secret.com -> 9/11 Conspiracies -> "Pentagon NTSB animation – three Cds."
http://www.abovetopsecret.com/forum/thread291782/pg1#pid3383439
[3] Farmer, John. "There is Always a Skeptic." 911files.info. June 5 2007. http://911files.info/blog/?p=230