Showing posts with label CSV. Show all posts

Thursday, September 6, 2007

CSV FINAL PLOTS

CSV FINAL PLOTS AND FINDINGS
Adam Larson / Caustic Logic
The Frustrating Fraud
September 7 2007

Again with the things that've been done before.

In trying to map out the final locations of the plane recorded in the csv file, I ran up against the problem of readings measured with degrees and minutes, but not seconds. This isn’t precise enough to see how the final plots compare to the official story; at 9:36:45 for example, it was somewhere in the zone marked by N38∞49',W077∞31', something like a square mile. While seconds are not recorded, minute rollovers and heading are, so I graphed out when it crossed what lines at what angle and went from there to use timeline seconds to help get a better idea of geographical seconds.

Lat-long minute lines crossed in the last minute of flight – just as the 330 loop was finishing and the plane straightened out on a 70 heading – 9:37:45-9:37:44:


The number of seconds taken to pass a certain way is marked off on that axis, true heading (mag angles minus ten degrees) are marked at each crossing (red), with the rest of flight filled in between (magenta). In retrospect my grid is slightly uneven, giving a mild wiggle to the flight path – but all proportions, times, and locations otherwise line up – as usual not exact but close enough to see a clear and logical pattern.

Which becomes interesting when it tries to line up with real-world grid lines, mapped here with the same curve from above matched with the official final trajectory and impact point.

A literal mapping would make no sense, putting the path consistently about 20 miles off to the west via the massive longitudinal offset previously calculated at about 22 minutes (about 1/3 of a degree) – but here I took the west-offset arbitrarily as a whole-minute difference of 21' to match closest lines in the area - W077∞30' mapped over W077°09', etc. Any possible north offset was ignored, with latitude lines placed the same (38∞52' mapped as 38°52').
The flight paths don’t match up, evidencing a north deviation of approximately 20 seconds north of real. The west reading appears roughly on with the 21 minute offset, but on closer inspection syops a bit short. The exact end point is less clear; considering one second left from the csv's last frame 'till impact, about 3-4 seconds at current rate to reach Pentagon from 04 line, this puts the readings again around 20-25 geo seconds too far west.

Csv flight path and corresponding grid shifted to match official flight path:

The Offset is roughly square or perhaps proportionate to the rectangular parcels marked out here – about a third of a minute on each side. So the West offset is now set by me at about 21’20” West and 0’20” north.

Friday, August 24, 2007

CSV / ANIMATION / OFFICIAL FLIGHT PATH AGREEMENT

CSV / ANIMATION / OFFICIAL FLIGHT PATH AGREEMENT
Adam Larson / Caustic Logic
The Frustrating Fraud
August 24 2007


A small post to tide my swarming readers over until I finish my animation geography analysis; I recently found, for what it’s worth, both the animation and the csv file seem to agree with the official story [ed - on this issue - the general flight path]. This is nothing new, of course, but barring minor variations of whatever significance, and looking at the 320-mile long swathe of land flown over by Flight 77, it’s all a remarkable fit.

Earthtools tells me the furthest point west in the official path is about 82° 44' 56” W, while the csv file records 83°06’ as the largest west number. These two numbers are off by about 21-22 minutes (no seconds recorded in the csv so exact margin cannot be determined), or about the margin they’re off by for the whole flight (explained here). So the official story and the csv file (corrected) match on lat/long readings at the furthest point west, and they also match at Dulles and the Pentagon; by being about 22 degrees apart across the board, they verify the board. As for the animation, I ignored its apparent lat/long grid appearing consistently off, and just used it to place the plane roughly at given times on its flight path (for example, just before a left turn at 8:39).

I made this map by stretching the 9/11 Commission’s flight path map w/state borders to fit a larger map of those borders. I then recreated the path (a bit rough in the curves) for greater clarity. I set the lat/long grid lines beneath it with Earthtools. Along the flight path, I marked 19 timed locations at key times. These were first plotted visually according to the animation, and then fine-tuned with the csv file (west corrected).

Note the remarkable, if not exact, correlation of all these data sets. The plots are off by a few minutes here and there, but on the scale of this 320-mile long swathe it all generally lines up. This is not surprising of course, as the Commission’s map and the official story in general have always relied on the flight path first downloaded we’re told within days of the attack. Just take this as another verification that the official data all lines up on the big picture flight path issue, and another excuse for me to publish a cool new graphic.

Thursday, August 16, 2007

CSV/ANIMATION ALTITUDE DISCREPANCY

CSV/ANIMATION INITIAL ALTITUDE DISCREPANCY
Adam Larson / Caustic Logic
The Frustrating Fraud
August 16 2007
last updated 8/21


Note: Pilots for Truth senior member “Undertow,” who I admit has far more knowledge in this area than I, commented on the following piece “You can not possibly be this moronic about this. Please for the love of god stop confusing everyone.” (see comments below)

I read this as his seeing too many mistakes to be accidental, and so it’s probably an attempt to confuse, a feeling I'm familiar enough with. No, in fact, I can be, and was, this moronic. I am off on a lotta spots here, numbers and otherwise. Sorry, I was tired and inspired at the same time. The general gist is still right, but numerous minor alterations and further notes are to come… (in red) Apologies for any remaining confusion and please don’t take this as a final word on anything without consulting a non-obfuscationist expert first. In fact I'm not even saying much at all here.

But as “mod” says below “CL is going in the right direction IMHO. What does the Video say vs. the CSV file, in terms of pure numbers? 99% should match.” I also feel I’m onto something here or I wouldn’t’ve posted it… I just don’t know what yet. Maybe it’s nothing. But UT’s vehemence has inspired me: “Jesus, please stop and really think about this before posting anymore absolute nonsense.” Have done, and I got lots of red here now. Jesus. I'm done.

For more in-depth, piloty, and udeful analysis of pressure altitude readings, please see the lively and enlightened Pilots for Truth discussion thread at this link. Hopefully you're a member, or perhaps they'll provide me with a better link to help explain what I'm missing here. Otherwise do your own research or just hang tight to see what I come up with.
---
Where I was Wrong
Aha! I feel stupid but not really. I had previously concluded that the original, takeoff altitude for Flight 77 in the csv fille matched the same in the NTSB animation. It turns out I was incorrect. It was a mistake on my part but kind of odd how easily it lent itself to misreading.

1) The actual altitude at Dulles is about 300 ft msl as I’d heard. I verified this with Earthtools; runway 30 is on an slight uphill slope from about 285-295 feet MSL. I’ll call it 290.

2) The NTSB animation shows precisely 300 feet in the altitude dial on the ground. It’s not quite right, but close enough to be accurate. It also happens to match almost exactly the magnetic heading on that runway of 300 degrees from magnetic north, also displayed as 302 with the plane at rest.

The csv agrees on mag heading and lists it as 302 for the long runway pause, which is where I got mixed up. When I first dug in for altitudes, I saw it was luckily only the fifth of several hundred settings so would be easy enough to find. I had heard takeoff altitudes matched, so looked first for an altitude of about 300, I counted over five, six, whatever values and saw 302. Not realizing it was actually the mag heading, I took it as a verification of the animation’s rough accuracy. The reason I missed the actual pressure altitude is that it’s unusually different from the display alt at that point, while the mag heading is still much closer, if it were altitude in feet. And they’re listed right next to each other so I got mixed up.

In fact the beginning altitude listed in the csv is 40 feet, 250 feet too low to be accurate. This is a point of disagreement I haven’t heard anyone mention yet, though Undertow tells me I’m “covering ground which we plowed last summer.”

Tho it didn't come across as I noted a discrepancy, I do also understand the csv and animation attitudes should not exactly match – as UT usefully points out “The FDR produces a Pressure Alt and Baro column in the CSV. Together they create what the pilot would see on the Actual Alitmeter. Which is what is supposed to be shown in the Animation.” That is, the pressure alt reading “+” barometer correction = real altitude. The exact relation and expected differences I’m not totally clear on but getting there [another post]. What I'm really noting here is a massive difference I hadn't noticed before, apparently the mirror image of the 300-foot part of John Doe X's correction.

Tracking Back
I stumbled on this error while looking into another, related anomaly, a search that involved lots of backtracking. I saw that the final altitudes at 9:37:44 are near identical – 180 for the animation’s dial and 173 for the csv (of course they aren’t supposed to be, because of the omitted barometer reset). This final altitude is however misleading, and seems to be from a frame of data that didn’t play out and would have left the animation considerably lower. In the four seconds before that, the two reading carried a rapidly decreasing difference of 50 feet to 28 feet, with the animation lower. I didn’t bother tracking this discrepancy, but noted that they match up closer back around 9:24 (animation about 15-20 feet lower than the csv), both before and after the mysterious FL180 reset recorded in the csv that had no effect on the animation readout.

So clearly the altitude difference between the two is all across the board, but nothing in the difference range of hundreds of feet. Tracing back further, they also match roughly after the initial FL180 reset on ascent (at 8:28) with difference of 20-30 feet but with the animation higher this time. Since it reads lower near the end, there is a roughly 75-foot fudge room, at least, between the two, that comes in somewhere between 8:28 and 9:24. I don’t feel like tracking this down, especially since I had been looking for something else.

An Inexplicable 240-foot Gap
At the initial FL180 reset, on ascent, at 8:28, Pandora’s Black Box shows an altitude drop from 18273 to 18058, a difference of 215 feet. Despite having matched the csv before that (I thought) and after being only about 27 feet off. There is 242 feet of total discrepancy here, most of which is lost at 8:28 leaving a near-match after, which means the animation must’ve been set much higher than the csv before the change. Another error of the cartoon, no doubt.

I’d never noted it before, but lo and behold, the altitudes do not match before that onscreen drop. The difference is in fact about 280 feet, animation high. Since I “knew” they matched on the runway at 8:20, I traced it back over the intervening eight minutes to see where the discrepancy crept in. Actually I started at the beginning and made the same mistake of identifying 300 and then watched for the up-tick to match the animation after it started rising at 8:20:16. I suspected the csv would be slower, but it remained at about 300 all-down the 300-oriented runway second after second as the animated plane rose. Then I realized I was looking at the wrong column, that the discrepancy runs back to the first frames and the csv file’s original altitude is wrong – to the tune of 250 feet underground, the same discrepancy nearly erased with the onscreen altitude change (leaving as the remainder the smaller discrepancy).

Here is a table of data at the relevant points: "baro cor" is the setting re-set at 18,000 feet both ways, once apparently by Capt. Burlingame, once by capt. Hanjour. + differences mean animation high, - means csv higher than animation.
time |baro cor | anim alt | csv alt | diff.
8:20:15 | -- | 300 | 59 |+241
8:20:16 | 30.20 | 304 | 52 |+252
8:20:17 | -- | 311 | 49 | +262
8:20:18 | 30.21 | 323 | 53 | +270
8:20:19 | -- | 339 | 61 | +278
8:20:20 | 30.20 | 363 | 83 | +280
8:20:21 | -- | 392 | 111 | +281
8:20:22 | 30.21 | 420 | 144 | +276
8:20:23 | -- | 456 180 +276
8:20:24 30.20 494 210 +284
8:20:25 -- 530 248 +231
8:20:26 30.21 568 290 +278
8:20:27 -- 614 330 +284
8:20:28 30.20 662 372 +290
8:20:29 -- 704 417 +287
8:20:30 | 30.21 | 755 | 469 |+ 286

8:27:54 | 30.21 | 18081 | 17785 |+296
8:27:55 | -- | 18129 | 17823 |+306
8:27:56 29.91 18140 17861 +279
8:27:57 -- 18179 17899 +280
8:27:58 30.21 18219 17938 +280
8:27:59 -- 18252 17976 +276
8:28:00 29.91 18166 18015 +151
2:28:01 -- 18083 18056 +27
8:28:02 30.21 18118 18093 +25
8:28:04 29.91 18198 18170 +29
8:28:06 | 29.94 | 18278 | 18247 | +30
… …
9:24:10 | 29.92 | 18264 | 18285 | -21
9:24:11 --- 18222 18245 -23
9:24:12 29.91 18185 18205 -20
9:24:13 -- 18151 18168 -17
9:24:14 29.92 18106 18126 -20
9:24:15 -- 18071 18088 -17
9:24:16 30.23 18030 18049 -19
9:24:17 -- 17993 18011 -18
9:24:18 | 30.01 | 17956 | 17972 | -16
… ... ...
9:37:40 | 30.23 | 445 | 496 | -51
9:37:41 --- 351 399 -48
9:37:42 30.24 279 307 -28
9:37:43 --- 211 239 -28
9:37:44 | 30.23 | 180 | 173 | +7
---
Here is the graph of five seconds at each of the four key spots. One can see how a roughly 300-foot jump in the animation altitude (red) would be expected at the second re-set. I'm not sure what exactly to make of this, this is just to illustrate. (view in new window to see it full-size)

Clearly, there is a massive discrepancy only for the first eight minutes of flight and back on the runway. So this piece stands as two points:

1) I correct myself on a silly mistake – the initial csv altitude I had previously worked with was grossly wrong
2) Whether or not they should, the animation dispaly and csv pressure altitudes roughly match all through the flight, as I have previously noted, except for these first eight minutes.

And since I just now figured this out I don’t want to say what it means – if the JDX correction is boosted by this or if this reveals something else. That's in the math I'll do a bit later. But it cleary raises questions about the data itself, if not about what physically happened.

Monday, August 13, 2007

NTSB ANIMATION INTERNAL GEOGRAPHY, PART 2

NTSB ANIMATION INTERNAL GEOGRAPHY, PART 2:
LONGITUDE LINES
Adam Larson / Caustic Logic
The Frustrating Fraud
July 12 2007
Updated Sept 3


As a primarily west-then-eastbound flight, 77 would have crossed more n-s running longitude lines than it would latitude lines. So in mapping what the NTSB animation shows in comparison to reality, let’s start with this more tedious operation with a larger room for error before the more delicate reading required for the latitude lines.

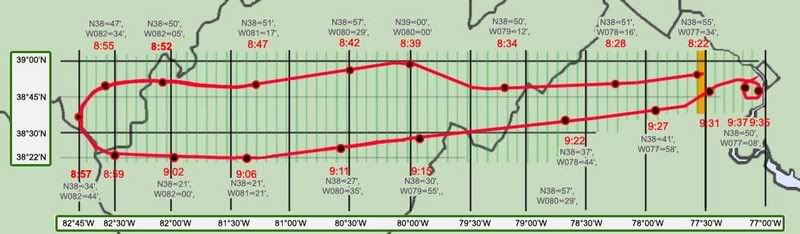
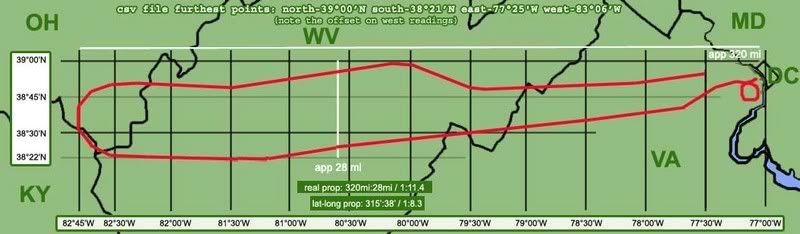
This map is based on the official path in the 9/11 Commission Report, with real-world latitude and longitude lines mapped behind it. I’ve marked longitude lines (vertical, running to the geographic north pole) at the degree and 30-minute marks, and the latitudes at intervals of 15 minutes, with the exception of the westernmost and southernmost lines, which are where they are.
right-click, new window, for full-size

Full proportions of the flight:
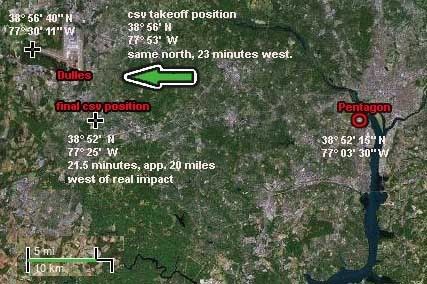
Flight 77’s takeoff coordinates, which I’ve taken as the end of runway 30 at Dulles, are 38 degrees, 56 minutes, 40 seconds north of the equator (38° 56' 40" N) and 77 degrees, 30 minutes, 11 seconds west of Greenwich. (77° 30' 11" W).

furthest point west: 82° 44' 56" W (83°06 by the NTSB's csv file, which is 22 degrees off)
furthest point east - 77°03’30” (again, 77°25' by the csv)

Total distance traveled west from Dulles:
82° 44' 77° 30' = 5° 15'
5.25 degrees, about 295 miles, 315 minutes, 18,900 seconds.
Lateral return distance to the Pentagon: 320 miles from furthest point west, just under 5.75 degrees, 345 minutes, 20,700 seconds.

So one thing to note here is that the official story's east-west-locations match the plots recorded in the csv; that is, by being about 22 degrees apart across the board, they verify the board. Now that we’ve parceled up reality with a multiple corroborated map, let’s see what the animation shows for longitude lines crossed. If the rendering program were marking at degree lines (77, 78, 79...), we’d see only five of them crossed on the way out. If they were marked at the 30-minute points as I’ve done here, we’d see 11 of them, and 314 if split up at the minute level. If they were marked wherever else…

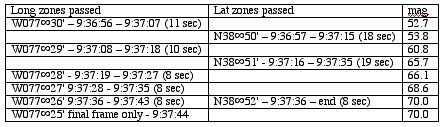
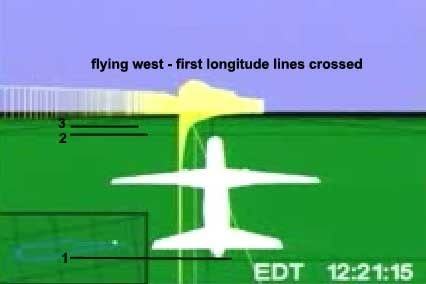
Looking at the animation, the first longitude line crossed comes soon after leaving the runway. This line passes off-screen at about 12:21:15, or 8:21 am, by the animation’s time code. The second line is crossed around 12:22:10, and so on every minute or so thereafter.
For example, line 23 is passed around 8:34:15, after which the animation shows the plane turning north, with line 24 and the next passing off-screen around 34:40, 35:15, 35:50, etc.

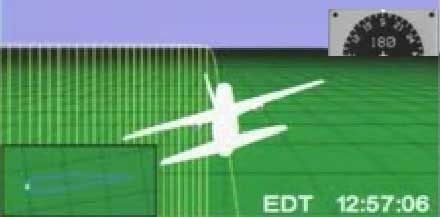
The last lines are hard to read, as the plane turns south to head back. The plane turns sharply to the left after 8:54, just after the hijacking commenced, making the ground track hard to follow. The final lines were crossed more slowly; line 61 would have been crossed around 8:54, and the final mark passed obliquely around 8:55:30, nearing but never crossing the next longitude marker as it turned to a south bearing of 180 at about 8:57, and kept turning to point east and return.
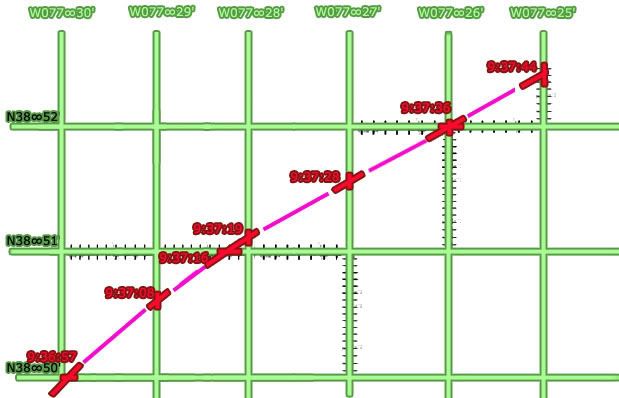
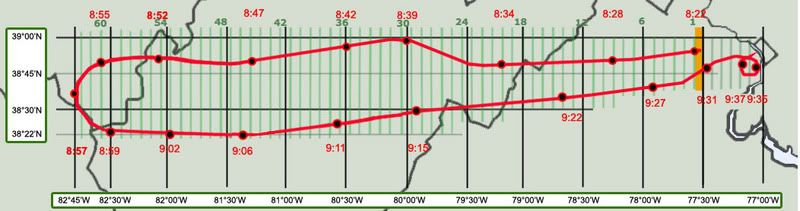
So I may be off by one or two lines, but this is a large enough sample that I’ll say close enough. Sixty-two perpendiculars passed means 63 marked longitude zones traversed on the initial westbound flight, and one would presume a few more on the return flight that overshot the origin by a 20 miles. On the map below, I marked 62 vertical lines, evenly spaced (to a pixel or two), and stretched it over the flight path from just after the origin point ay 77° 30'. It lines up roughly with an interval of five minutes real, there being an average of six divisions to each 30’ interval.
right-click, new window, for full-size

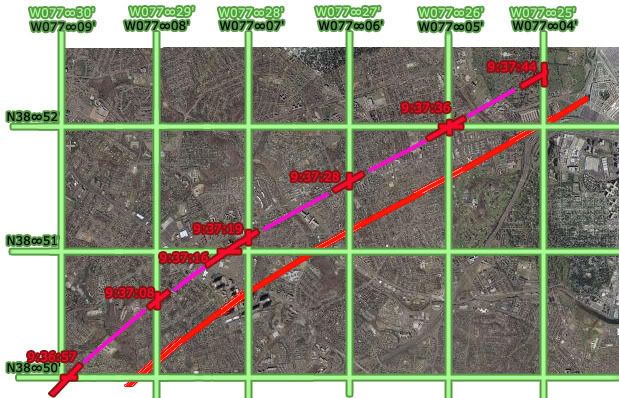
Mathematically, it also happens that 5 times 63 gives us 315, the number of minutes I figure were passed. So whether by design or not, the global map is marking intervals of about five minutes on its east-west axis. This would mean 12 markers per degree, which seems an odd but logical enough system. It does simplify the reading of it; no way would I have tried to count 314 passing blurry lines.

Or it could be a coincidence that my imprecise reading closely matches such a possible system. Either way, it carries over into the final stretch before impact. Presuming the same 62 lines crossed until the plane passed south of Dulles, It seems the return flight tops it by another six. The origin zone is entered at about 9:29:30 in the animation, the first line east of there crossed soon after, and then five more. The sixth line is the only one crossed twice; at 9:34 as it starts the 330 southward loop, and again as it straightens out from this and dives to its terminus, nearing but not passing the seventh longitude line east of Dulles. The proportions that described the westbound flight apply here as well, with the zone from 77:30-77:00 looking to be marked into about six parcels of five minutes each.

It’s possible that these lines do not in fact run due north, but are offset due to the grid being oriented to magnetic north. Trying to compare and calculate their verticality based on the visuals in the animation seems daunting. More precision is possible with the much fewer latitude lines. These seem to run near-parallel to most of the flight, giving us readable slants over certain distances. To determine both the possible slope of an offset grid, and to look at the proportions of the marked parcels, we’ll need to look at these presumably east-west lines, which it seems will require yet another separate post. This analysis will be far more interesting and its graphics more colorful; I’m seeing patterns that bring into question the global grid’s orientation and even internal consistency. Maybe. I’m still looking.

Saturday, August 4, 2007

THE CSV FILE

THE CSV FILE
Adam Larson / Caustic Logic
The Frustrating Fraud
August 4 2007
rough draft


Released by the NTSB via FOIA request to Pilots for 9/11 Truth member Undertow in August 2006, the “csv file” is one of the more widely-cited sources of Flight 77 FDR information. It’s a huge file – offered by the Pilots for download:

The CSV file, AAL77_tabular.csv (zipped): dowload link

A text list of the parameters plotted: dowload link

It’s a bitch to read. I had initially only been able to open the file as simple text file, with well over 300 values (I stopped counting) each represented in packed clusters for each second of the hour-and-a-half doomed flight, a total of nearly 4,700 frames. A single frame looks like this (highlighted in red is the data for the first frame at 8:19:00 am - the last frame is 9:37:44, ending as the animation does one second early):


Opening it in Excel, once I figured that out, helped little, as it doesn’t really organize the data into readable columns.


Each comma separates one of the myriad values from the next (hence the file type CSV, or “comma separated value”). Many many of them, where there are commas in a row, are blank or inoperative; the NTSB’s SFRI noted that even though “the recorder operated normally,” that report, and the CSV as well, included “only validated parameters.” The blank values, including the radio altimeter, “either were not recorded properly or were not confirmed to have been recorded properly.”

Most remain readable, but with so many values presented this way, the only way I can find anything is to have a good guess of the value I’m looking for (29.92, latitude, etc.) and do a search ‘till I find it. Out of this mess and my relative ignorance (and sporadic, stumbling tenacity), I’ve been able to verify a few oddities proposed by Undertow and his cohorts at P49T: the pressure altitude reset said to place the plane too high for impact, and the 20-mile longitudinal offset, which seems odd but irrelevant.
- I had misread the initial pressure altitude recorded and concluded the csv and animation altitudes in fact matched at the beginning, which they don't. Initial altitude reading: 40 ft msl, 250 feet underground at Dulles, 260 below the animation readout. A mess of a post... and a graph
- The numbers in the tabular csv file match the official story's flight path in latitude/longitude plots (once corrected) and timeline. Nothing new but another verification and a nifty new graphic.
- There seems to be a slight north offset as well, depending on if I'm reading this right. At any rate, the graphing of the csv final plots that helped me see this is interesting for its own reasons.

20 MINUTES AND 20 MILES FROM TRUE

20 MINUTES AND 20 MILES FROM TRUE
CSV LONGITUDE READINGS
Adam Larson / Caustic Logic
The Frustrating Fraud
August 4 2007


A recent anonymous comment left under my post Pentagon NTSB Animation is Wrong! said:

“Funny stuff watching a bunch of half witted pilots and so called experts run around making up ideas on something they do not understand but have been told about. Take a look at the FDR data please. Now tell me where is Flight 77 at takeoff, and at the last data point. Come on experts like Snowy, tell me where Flight 77 is. Any point in time will do. Bet you can not place it better than 1000 to 3000 feet. Too bad we did not have GPS to knock that down to 100 to 300 feet. Sad thing is, after reading the posts around the internet, the FDR was found in the Pentagon as were all the bodies from77. The people who make up stuff about Flight 77 are sick people.” [1]

I remembered some comments from the “experts” at Pilots for 9/11 Truth about positional problems in this data, so I took the challenge and found – ironically enough – the debunker had pointed to an interesting anomaly that it seems places the plane’s final resting place twenty miles west of the Pentagon. I duly note the irony that this gives me something to agree with the Pilots over, as core member Undertow had just alerted me of “the CSV Lat/Lon data screw up,” wherein “it is off by 20 Minutes.” [2]

It’s somewhat daunting to look into the CSV file, but this time it only took a few minutes to ascertain the final recorded position: N38°52',W077°25'. There are no seconds reading to pinpoint (60 seconds make a minute, 60 minutes a degree), but it appears about right for north placement, but far off for the longitudinal (east-west) placement. It should read 77°3’30” Indeed, it’s off by 21.5 minutes, in this case a discrepancy of roughly 20 miles, or directly over Chantilly.

Where does this discrepancy enter the picture? I feared it would take a while to track it back, but again, no problem. Location at takeoff (from frame 08:21:27: N38°56',W077°53' The map I looked at places the end of the runway at 38° 56' 40" N, 77° 30' 11" W. Again the same northern position, but 23 minutes to the west. The discrepancy is there the whole time. The slight difference is probably due to the lack of seconds data that would tell just where in each zone it was for sure, introducing a small fudge factor of inevitable imprecision.
Pilots ally John Farmer has analyzed the data closely and found it "unreliable," and now I see clearly what means when he says the csv file "has the plane taking off from a field west of Dulles and crashing somewhere well west of the Pentagon (look at the coordinates stupid).” [3] In fact, as seen in the map above, its data ended just south of Dulles where it was supposed to have begun. The data set gets curiouser and curiouser. But why? And to what net effect?

The difference runs across the board and so is almost as easy to correct as the animation's four-hour-ahead time stamp. Simply add about 21-23 minutes to the west readings. That and realize there’s no real precision possible with the csv’s numbers other than that it took off just as Flight 77 departed Dulles, and ended just about 20 miles east of this origin just at nearly the second that Flight 77 is said to have hit the Pentagon 20 miles east of it's origin. I can’t say for sure but this FDR anomaly seems massive, inexplicable, and totally irrelevant.

Sources:
[1] http://frustratingfraud.blogspot.com/2007/05/ntsb-animation-is-flat-wrong.html - comment left 7/27/07, 7:56 pm
[2] Undertow. Posted July 26 2007, 9:36 am. Above Top Secret.com -> 9/11 Conspiracies -> "Pentagon NTSB animation – three Cds."
http://www.abovetopsecret.com/forum/thread291782/pg1#pid3383439
[3] Farmer, John. "There is Always a Skeptic." 911files.info. June 5 2007. http://911files.info/blog/?p=230