LONGITUDE LINES
Adam Larson / Caustic Logic
The Frustrating Fraud
July 12 2007
Updated Sept 3
As a primarily west-then-eastbound flight, 77 would have crossed more n-s running longitude lines than it would latitude lines. So in mapping what the NTSB animation shows in comparison to reality, let’s start with this more tedious operation with a larger room for error before the more delicate reading required for the latitude lines.
This map is based on the official path in the 9/11 Commission Report, with real-world latitude and longitude lines mapped behind it. I’ve marked longitude lines (vertical, running to the geographic north pole) at the degree and 30-minute marks, and the latitudes at intervals of 15 minutes, with the exception of the westernmost and southernmost lines, which are where they are.
 right-click, new window, for full-size
Full proportions of the flight:
Flight 77’s takeoff coordinates, which I’ve taken as the end of runway 30 at Dulles, are 38 degrees, 56 minutes, 40 seconds north of the equator (38° 56' 40" N) and 77 degrees, 30 minutes, 11 seconds west of Greenwich. (77° 30' 11" W).
furthest point west: 82° 44' 56" W (83°06 by the NTSB's csv file, which is 22 degrees off)
furthest point east - 77°03’30” (again, 77°25' by the csv)
Total distance traveled west from Dulles:
82° 44' 77° 30' = 5° 15'
5.25 degrees, about 295 miles, 315 minutes, 18,900 seconds.
Lateral return distance to the Pentagon: 320 miles from furthest point west, just under 5.75 degrees, 345 minutes, 20,700 seconds.
So one thing to note here is that the official story's east-west-locations match the plots recorded in the csv; that is, by being about 22 degrees apart across the board, they verify the board. Now that we’ve parceled up reality with a multiple corroborated map, let’s see what the animation shows for longitude lines crossed. If the rendering program were marking at degree lines (77, 78, 79...), we’d see only five of them crossed on the way out. If they were marked at the 30-minute points as I’ve done here, we’d see 11 of them, and 314 if split up at the minute level. If they were marked wherever else…
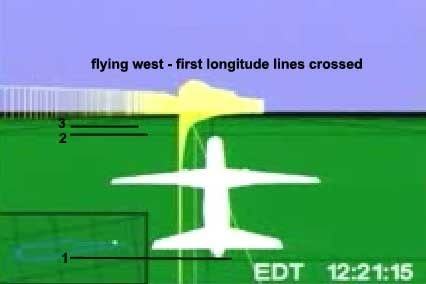
Looking at the animation, the first longitude line crossed comes soon after leaving the runway. This line passes off-screen at about 12:21:15, or 8:21 am, by the animation’s time code. The second line is crossed around 12:22:10, and so on every minute or so thereafter.
 For example, line 23 is passed around 8:34:15, after which the animation shows the plane turning north, with line 24 and the next passing off-screen around 34:40, 35:15, 35:50, etc.
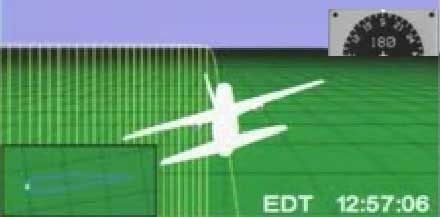
 The last lines are hard to read, as the plane turns south to head back. The plane turns sharply to the left after 8:54, just after the hijacking commenced, making the ground track hard to follow. The final lines were crossed more slowly; line 61 would have been crossed around 8:54, and the final mark passed obliquely around 8:55:30, nearing but never crossing the next longitude marker as it turned to a south bearing of 180 at about 8:57, and kept turning to point east and return.
 So I may be off by one or two lines, but this is a large enough sample that I’ll say close enough. Sixty-two perpendiculars passed means 63 marked longitude zones traversed on the initial westbound flight, and one would presume a few more on the return flight that overshot the origin by a 20 miles. On the map below, I marked 62 vertical lines, evenly spaced (to a pixel or two), and stretched it over the flight path from just after the origin point ay 77° 30'. It lines up roughly with an interval of five minutes real, there being an average of six divisions to each 30’ interval.
  right-click, new window, for full-size
Mathematically, it also happens that 5 times 63 gives us 315, the number of minutes I figure were passed. So whether by design or not, the global map is marking intervals of about five minutes on its east-west axis. This would mean 12 markers per degree, which seems an odd but logical enough system. It does simplify the reading of it; no way would I have tried to count 314 passing blurry lines.
Or it could be a coincidence that my imprecise reading closely matches such a possible system. Either way, it carries over into the final stretch before impact. Presuming the same 62 lines crossed until the plane passed south of Dulles, It seems the return flight tops it by another six. The origin zone is entered at about 9:29:30 in the animation, the first line east of there crossed soon after, and then five more. The sixth line is the only one crossed twice; at 9:34 as it starts the 330 southward loop, and again as it straightens out from this and dives to its terminus, nearing but not passing the seventh longitude line east of Dulles. The proportions that described the westbound flight apply here as well, with the zone from 77:30-77:00 looking to be marked into about six parcels of five minutes each.
It’s possible that these lines do not in fact run due north, but are offset due to the grid being oriented to magnetic north. Trying to compare and calculate their verticality based on the visuals in the animation seems daunting. More precision is possible with the much fewer latitude lines. These seem to run near-parallel to most of the flight, giving us readable slants over certain distances. To determine both the possible slope of an offset grid, and to look at the proportions of the marked parcels, we’ll need to look at these presumably east-west lines, which it seems will require yet another separate post. This analysis will be far more interesting and its graphics more colorful; I’m seeing patterns that bring into question the global grid’s orientation and even internal consistency. Maybe. I’m still looking.


No comments:
Post a Comment