Adam Larson / Caustic Logic
The Frustrating Fraud
August 16 2007
last updated 8/21
Note: Pilots for Truth senior member “Undertow,” who I admit has far more knowledge in this area than I, commented on the following piece “You can not possibly be this moronic about this. Please for the love of god stop confusing everyone.” (see comments below)
I read this as his seeing too many mistakes to be accidental, and so it’s probably an attempt to confuse, a feeling I'm familiar enough with. No, in fact, I can be, and was, this moronic. I am off on a lotta spots here, numbers and otherwise. Sorry, I was tired and inspired at the same time. The general gist is still right, but numerous minor alterations and further notes are to come… (in red) Apologies for any remaining confusion and please don’t take this as a final word on anything without consulting a non-obfuscationist expert first. In fact I'm not even saying much at all here.
But as “mod” says below “CL is going in the right direction IMHO. What does the Video say vs. the CSV file, in terms of pure numbers? 99% should match.” I also feel I’m onto something here or I wouldn’t’ve posted it… I just don’t know what yet. Maybe it’s nothing. But UT’s vehemence has inspired me: “Jesus, please stop and really think about this before posting anymore absolute nonsense.” Have done, and I got lots of red here now. Jesus. I'm done.
For more in-depth, piloty, and udeful analysis of pressure altitude readings, please see the lively and enlightened Pilots for Truth discussion thread at this link. Hopefully you're a member, or perhaps they'll provide me with a better link to help explain what I'm missing here. Otherwise do your own research or just hang tight to see what I come up with.
---
Where I was Wrong
Aha! I feel stupid but not really. I had previously concluded that the original, takeoff altitude for Flight 77 in the csv fille matched the same in the NTSB animation. It turns out I was incorrect. It was a mistake on my part but kind of odd how easily it lent itself to misreading.
1) The actual altitude at Dulles is about 300 ft msl as I’d heard. I verified this with Earthtools; runway 30 is on an slight uphill slope from about 285-295 feet MSL. I’ll call it 290.
2) The NTSB animation shows precisely 300 feet in the altitude dial on the ground. It’s not quite right, but close enough to be accurate. It also happens to match almost exactly the magnetic heading on that runway of 300 degrees from magnetic north, also displayed as 302 with the plane at rest.
The csv agrees on mag heading and lists it as 302 for the long runway pause, which is where I got mixed up. When I first dug in for altitudes, I saw it was luckily only the fifth of several hundred settings so would be easy enough to find. I had heard takeoff altitudes matched, so looked first for an altitude of about 300, I counted over five, six, whatever values and saw 302. Not realizing it was actually the mag heading, I took it as a verification of the animation’s rough accuracy. The reason I missed the actual pressure altitude is that it’s unusually different from the display alt at that point, while the mag heading is still much closer, if it were altitude in feet. And they’re listed right next to each other so I got mixed up.
In fact the beginning altitude listed in the csv is 40 feet, 250 feet too low to be accurate. This is a point of disagreement I haven’t heard anyone mention yet, though Undertow tells me I’m “covering ground which we plowed last summer.”
Tho it didn't come across as I noted a discrepancy, I do also understand the csv and animation attitudes should not exactly match – as UT usefully points out “The FDR produces a Pressure Alt and Baro column in the CSV. Together they create what the pilot would see on the Actual Alitmeter. Which is what is supposed to be shown in the Animation.” That is, the pressure alt reading “+” barometer correction = real altitude. The exact relation and expected differences I’m not totally clear on but getting there [another post]. What I'm really noting here is a massive difference I hadn't noticed before, apparently the mirror image of the 300-foot part of John Doe X's correction.
Tracking Back
I stumbled on this error while looking into another, related anomaly, a search that involved lots of backtracking. I saw that the final altitudes at 9:37:44 are near identical – 180 for the animation’s dial and 173 for the csv (of course they aren’t supposed to be, because of the omitted barometer reset). This final altitude is however misleading, and seems to be from a frame of data that didn’t play out and would have left the animation considerably lower. In the four seconds before that, the two reading carried a rapidly decreasing difference of 50 feet to 28 feet, with the animation lower. I didn’t bother tracking this discrepancy, but noted that they match up closer back around 9:24 (animation about 15-20 feet lower than the csv), both before and after the mysterious FL180 reset recorded in the csv that had no effect on the animation readout.
So clearly the altitude difference between the two is all across the board, but nothing in the difference range of hundreds of feet. Tracing back further, they also match roughly after the initial FL180 reset on ascent (at 8:28) with difference of 20-30 feet but with the animation higher this time. Since it reads lower near the end, there is a roughly 75-foot fudge room, at least, between the two, that comes in somewhere between 8:28 and 9:24. I don’t feel like tracking this down, especially since I had been looking for something else.
An Inexplicable 240-foot Gap
At the initial FL180 reset, on ascent, at 8:28, Pandora’s Black Box shows an altitude drop from 18273 to 18058, a difference of 215 feet. Despite having matched the csv before that (I thought) and after being only about 27 feet off. There is 242 feet of total discrepancy here, most of which is lost at 8:28 leaving a near-match after, which means the animation must’ve been set much higher than the csv before the change. Another error of the cartoon, no doubt.
I’d never noted it before, but lo and behold, the altitudes do not match before that onscreen drop. The difference is in fact about 280 feet, animation high. Since I “knew” they matched on the runway at 8:20, I traced it back over the intervening eight minutes to see where the discrepancy crept in. Actually I started at the beginning and made the same mistake of identifying 300 and then watched for the up-tick to match the animation after it started rising at 8:20:16. I suspected the csv would be slower, but it remained at about 300 all-down the 300-oriented runway second after second as the animated plane rose. Then I realized I was looking at the wrong column, that the discrepancy runs back to the first frames and the csv file’s original altitude is wrong – to the tune of 250 feet underground, the same discrepancy nearly erased with the onscreen altitude change (leaving as the remainder the smaller discrepancy).
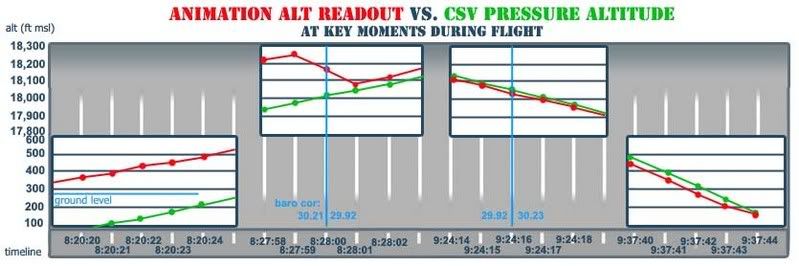
Here is a table of data at the relevant points: "baro cor" is the setting re-set at 18,000 feet both ways, once apparently by Capt. Burlingame, once by capt. Hanjour. + differences mean animation high, - means csv higher than animation.
time |baro cor | anim alt | csv alt | diff.
8:20:15 | -- | 300 | 59 |+241
8:20:16 | 30.20 | 304 | 52 |+252
8:20:17 | -- | 311 | 49 | +262
8:20:18 | 30.21 | 323 | 53 | +270
8:20:19 | -- | 339 | 61 | +278
8:20:20 | 30.20 | 363 | 83 | +280
8:20:21 | -- | 392 | 111 | +281
8:20:22 | 30.21 | 420 | 144 | +276
8:20:23 | -- | 456 180 +276
8:20:24 30.20 494 210 +284
8:20:25 -- 530 248 +231
8:20:26 30.21 568 290 +278
8:20:27 -- 614 330 +284
8:20:28 30.20 662 372 +290
8:20:29 -- 704 417 +287
8:20:30 | 30.21 | 755 | 469 |+ 286
…
8:27:54 | 30.21 | 18081 | 17785 |+296
8:27:55 | -- | 18129 | 17823 |+306
8:27:56 29.91 18140 17861 +279
8:27:57 -- 18179 17899 +280
8:27:58 30.21 18219 17938 +280
8:27:59 -- 18252 17976 +276
8:28:00 29.91 18166 18015 +151
2:28:01 -- 18083 18056 +27
8:28:02 30.21 18118 18093 +25
8:28:04 29.91 18198 18170 +29
8:28:06 | 29.94 | 18278 | 18247 | +30
… …
9:24:10 | 29.92 | 18264 | 18285 | -21
9:24:11 --- 18222 18245 -23
9:24:12 29.91 18185 18205 -20
9:24:13 -- 18151 18168 -17
9:24:14 29.92 18106 18126 -20
9:24:15 -- 18071 18088 -17
9:24:16 30.23 18030 18049 -19
9:24:17 -- 17993 18011 -18
9:24:18 | 30.01 | 17956 | 17972 | -16
… ... ...
9:37:40 | 30.23 | 445 | 496 | -51
9:37:41 --- 351 399 -48
9:37:42 30.24 279 307 -28
9:37:43 --- 211 239 -28
9:37:44 | 30.23 | 180 | 173 | +7
---
Here is the graph of five seconds at each of the four key spots. One can see how a roughly 300-foot jump in the animation altitude (red) would be expected at the second re-set. I'm not sure what exactly to make of this, this is just to illustrate. (view in new window to see it full-size)
Clearly, there is a massive discrepancy only for the first eight minutes of flight and back on the runway. So this piece stands as two points:
1) I correct myself on a silly mistake – the initial csv altitude I had previously worked with was grossly wrong
2) Whether or not they should, the animation dispaly and csv pressure altitudes roughly match all through the flight, as I have previously noted, except for these first eight minutes.
And since I just now figured this out I don’t want to say what it means – if the JDX correction is boosted by this or if this reveals something else. That's in the math I'll do a bit later. But it cleary raises questions about the data itself, if not about what physically happened.


12 comments:
You can not possibly be this moronic about this. Please for the love of god stop confusing everyone.
DO NOT look at the animation until you understand the CSV please.
The FDR produces a Pressure Alt and Baro column in the CSV. Together they create what the pilot would see on the Actual Alitmeter. Which is what is supposed to be shown in the Animation.
Jesus, please stop and really think about this before posting anymore absolute nonsense.
Thanks for the encouragement. Don't mind if I do keep stumbling ahead.
It's true there's many things I don't know. Apologies for any confusion I'm sowing. That's certainly not my intention. I'm just relating how I got confused myself, du one of my learning disabilities I guess. I had to post this to correct myself, in case anyone cares, that I had misread the mag heading as pressure alt. Big oops.
I'll update this post with baro cor abelelled right (thanks for that tip) and directing readers to you guys for more useful technical insights that would be beyond me.
No disrespect, but this "we're the only people in the world who knows anything about aviation" is getting a little tiring.
Too much emphasis is put on the animation. Look at the raw data coming off it. CL is going in the right direction IMHO. What does the Video say vs. the CSV file, in terms of pure numbers? 99% should match. The FDR is loaded into an app and an animation is produced off the data. This isn't Warner Bros studios where every frame is hand painted.
I have 2 CSV files that show two lots of different altitude data for the same fields. I'm intrigued how the Rad. Alt. data is claimed to be US on both channels in one of them, and doesn't match the altitudes for the other, when corrected for local pressure. I'm also amazed at the timing of the altimeter rest on the way down.
We know it doesn't add up (that should be evident by now) - the questions are WHAT, WHEN, HOW and WHY.
Unless the civilian pilots of the day screwed up prior to the hijack, there is something very wrong with the whole thing. I'm at a point where I think the real FDR data was never released, and the whole thing is a diversion.
[quote]In fact the beginning altitude listed in the csv is 63 feet, 227 feet too low to be accurate.[/quote]
If you're referring to the VERY first reading, this equates to the altimeter being 0.23 inHg off the local pressure, or the local pressure being 0.23 inHg ABOVE standard pressure (the altimeter is recorded at standard pressure).
29.92 + 0.23 = 30.15 inHg local pressure (working from the reported altitude vs. the known airfield elevation). Allowing for +/- 75ft deviation then that adds +/- 0.08 inHg inaccuracy to the pressure reading, making max/min pressure on the day 30.23/30.07 inHg.
RA = Radio Altimeter.
If ground level = 150 ft ASL, and local pressure = 30.14, then:
Alt difference between local and std pressure = ~220 ft.
RA = 0 ft
Alt (29.92) = -70 ft
Alt (30.14) = 150 ft
so if...
RA = 75 ft
ALT (29.92) = -145 ft
ALT (30.14) = 75 ft
...but we know
ALT (29.92) = 180 ft
therefore...
ALT (30.14) = 400 ft
Assuming for a moment though that
ALT (30.14) = 180 ft
then,,,
ALT (29.92) = -40 ft
...we can only conclude the data is FUBAR or the aircraft overflew.
Thanks a ton, UT. Check the revised intro.
I typed this up the other day. It may help in understanding. And again, the CSV must be understood before looking at the video. You are actually covering ground which we plowed last summer.
~~
About the Animation.
One thing, and one thing only.
It took Human Intervention in order to Alter the Normal procedure of Computing the PresAlt and Baro raw Numbers into the Animated Altimeter. This is not a 'whoops' or 'working' anything. It WAS in there per practices and WAS UnSelected/Removed/Whatever in order to show a False representation of the Actual Data.
~~
It seems like there was supposed to be a link there or something?
--
"You are actually covering ground which we plowed last summer."
--
Yeah, I guessed so. That's just how I roll. Maybe if I plow it in a different direction I'll stumble on the buriai chamber of an ancient emperor full of treasures.
I didn't mean that the altitudes should match exactly, and do think I understand that the barometer correction affects the raw pressure alt reading to deliver truer altitude info, and thet the setting of the baro cor (whether 30.2ish or 29.91) will create a different reading. I just found the formula for this, I think, and MOD's given me some great numbers to pore over. What I'm wondering is the internal consistency of the corrections - it looks like I may just be reaffirming your findings that there should be a roughly mirrorisn rise at the second reset at 9:24. I dunno. It's a Monday thing
sorry, again. Okay
---
One thing, and one thing only.
It took Human Intervention in order to Alter the Normal procedure of Computing the PresAlt and Baro raw Numbers into the Animated Altimeter. This is not a 'whoops' or 'working' anything. It WAS in there per practices and WAS UnSelected/Removed/Whatever in order to show a False representation of the Actual Data.
---
I'd have to say, taking this all as legit, which I'm doing, and considering the general patterns, that you're probably right there. If the csv is that wrong at that setting at Dulles, it should be that wrong at roughly that setting at the Pgon. (Still working out the math for my own thing). This is all just very wierd.
As MOD said, it's either a flyover or screwed up data. Considering that some large plane hit the building - on about this flight path - I'd have to go with the latter? But I'm not able to fid much you guys haven't already found.
"If the csv is that wrong at that setting at Dulles, it should be that wrong at roughly that setting at the Pgon."
No. Your still saying wrong.
The CSV is right at Dulles and Pgon.
The animation is wrong only at Pgon.
And I'm not one to ever think just 2 options is enough. That's like restricting yourself to Left/Right and Dem/Rep.
There are many different ways the operation could've gone down. I could come up with more then 2 (not including the Official Story) at least. But if that's all I talked about then what, you know. :)
"No. Your still saying wrong.
The CSV is right at Dulles and Pgon.
The animation is wrong only at Pgon."
---
Duly noted. I meant off from each other by a wide margin. Theire not being off at the end IS the problem I agree, and the difference is in the animation's alt dial not doing the reverse of what it did at 8:28. I've removed the bolded WRONG in the article as well, which is chock full of red now and this whole thing turned out kinda stupid. But ah well. I got a cool new graph out of it.
And I know I come across as one-sided. But all things considered, as I see it, it's the only side with much, other than strange data, going for it. But I appreciate your input here, obviously. :)
Caustic Logic not logged in said...
Thanks a ton, UT. Check the revised intro.
UT? I meant mod. Never trust the non-logged in impersonators. ;)
Post a Comment